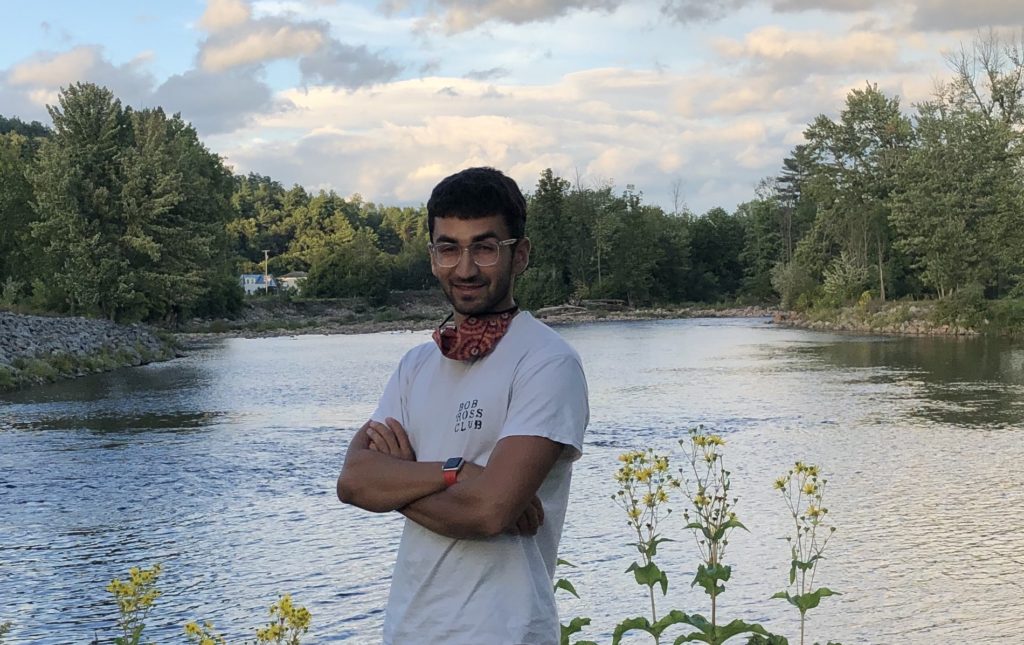
 Sam Vasen’s summer internship at The Watershed Institute was swept up into a digital world.
Instead of setting up deer fencing, yanking out invasive species and surveying the health of the forest understory with the Watershed’s Science Director Steve Tuorto, Ph.D., and other interns, his summer experience turned virtual.
Sam, 19, who grew up in Brooklyn, is a Princeton University sophomore majoring in Ecology and Evolutionary Biology. He selected the Watershed internship to build on his former experiences working in a native plant nursery in Brooklyn, mapping broken stones at a Brooklyn cemetery, and helping restore a native salt marsh in the borough’s Gowanus Canal Conservancy. The internship was part of a collaboration between the Watershed and the Princeton Environmental Institute (PEI).
 When the pandemic was scuttling many internships, Steve reached out to the PEI coordinator and convinced her to have Sam tackle a large set of forestry data.
“Sam really ran with this project and went above and beyond our expectations,” said Steve. “The information can be used to assess, at a glance, the composition and health of individual sections of the 950-acre Watershed Reserve, allowing us to investigate the cause of a problem in certain areas and plan for restoration work.”
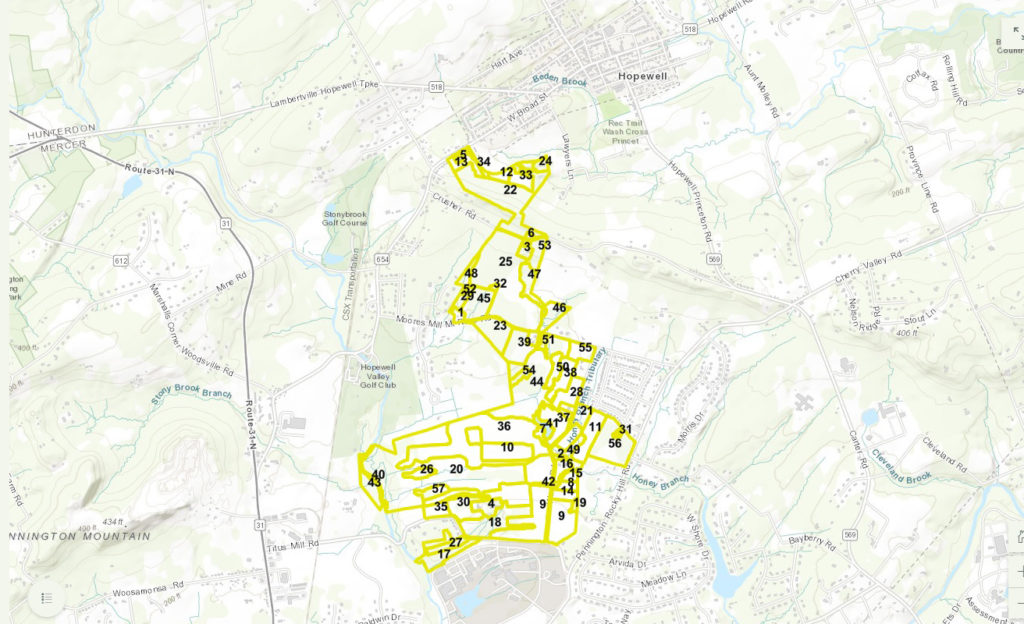
Sam combed through reams of forestry data on the reserve that was collected in 2018 and helped decide what was important and what to discard. Then he created his own story – an ArcGIS StoryMap, that is.
His StoryMap is a custom map that gives a visual presentation of forest health data. The map allows the viewer to drill down into one of the many sections, called “stands”, to learn about the dominant tree species, how much of the stand is healthy, and what invasive species are encroaching threats.
“When COVID-19 hit, we were looking for a virtual project that Sam could work on remotely,” added Allison Jackson, the Watershed’s Stewardship Coordinator. “I was thrilled that Sam could take this on. Sam helped us understand the data and figure out how to share it visually.”
 While Sam had some rudimentary GIS skills, he said he was able to refine his use of the technology. Most of his designs were done in the ArcGIS interface, where he made the data accessible and added images so people could quickly grasp its purpose. The StoryMap tool also helped people in the digital age, where attention spans are shorter, to understand the main concepts without having to wade through nonessential elements.
“I started doing some of the analysis of the data and made graphs and connections that I thought would be helpful to understand the Watershed’s goal,” he said. “When Steve and I were happy, we went back-and-forth on a way to present it to an audience. We thought a StoryMap accomplished this best and let us share the overall forest health and also show comparisons of different areas.”
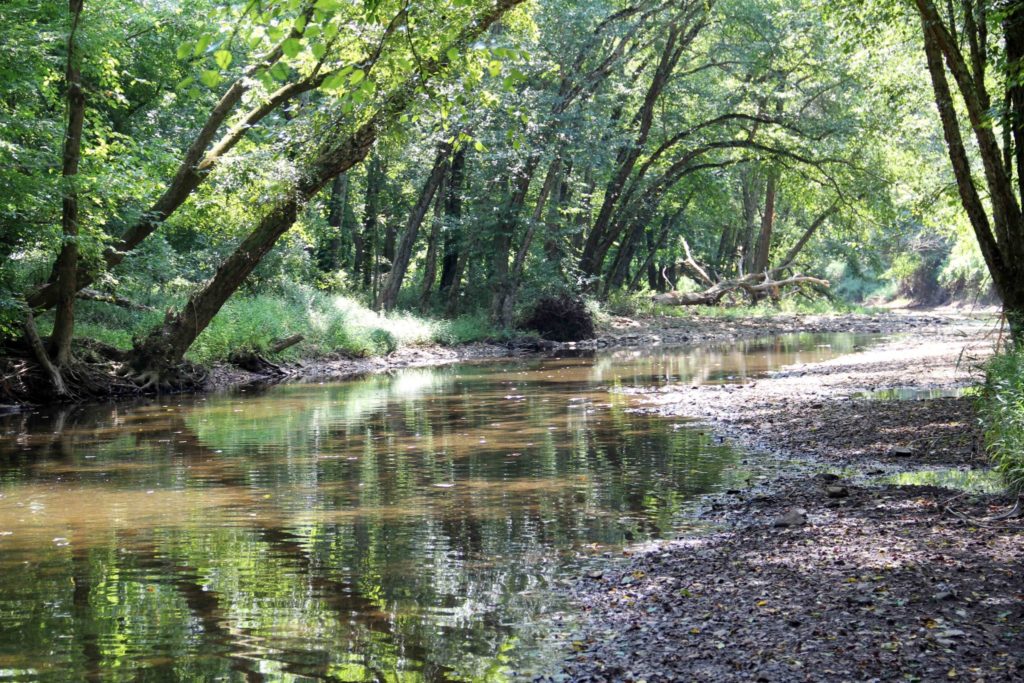
He said the hardest part this summer was not actually working from the Watershed or being able to explore the forest tracts and other elements of the Reserve. “It was tough not seeing what I was writing about and analyzing,” Sam said.
 Once he designed the base map, Sam added the legend, popups and embedded an audio track of northeastern forest sounds in a repeating loop to provide a sense of place. While he grew up in a big city, he spent summers in the Adirondacks and nurtured his appreciation of nature, land, and the wilds.
“Everyone’s priorities in New York City [aren’t] for nature, looking out for the trees and taking care of the parks. There isn’t a general land ethic that everyone holds,” Sam said. “As I have more experience, I’m more focused on learning about and valuing the land. Having a perception about nature and how natural systems work is the most valuable position I could hold to draw people in and make them care.”
With the fundamental map complete, in the future, the Watershed may use Sam’s StoryMap to present data on meadows, bird populations, flower mapping, and other natural resources.
“What I created with the limited data was a basic tool for determining basic land health,” he said “There is so much they could add on trees, meadows, and gardens. I’m excited to see what they do.”